-
Bug
-
Resolution: Done
-
Major
-
ACM 2.8.0
-
Observability Sprint 2023-08
-
Important
-
No
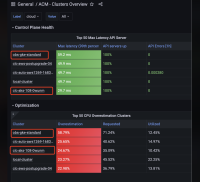
Description of problem: There's one AKS cluster, observability addon deployed on it, metrics data displaying on the Grafana dashboards. But this AKS is not in the cluster list on some dashboards.
Version-Release number of selected component (if applicable): 2.8.0-155
How reproducible:
Steps to Reproduce:
- Deploy MCOCR
- Observability addon is deployed on the AKS cluster
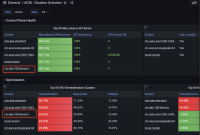
- open the grafana General / ACM - Clusters Overview Dashboard, AKS cluster data are displaying correctly

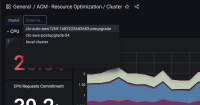
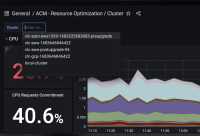
- But navigate to `General / ACM - Resource Optimization / Cluster`, the AKS cluster is not in the cluster dorp-down list

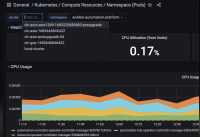
- This issue also existing on some other dashboards, like
General / USE Method / Cluster
General / Kubernetes / Compute Resources / Pod
General / Kubernetes / Compute Resources / Namespace (Workloads)
General / Kubernetes / Compute Resources / Namespace (Pods)
Actual results:
Expected results:
Additional info:
- account is impacted by
-
ACM-5291 [ACM QE] Observability - ACM 2.8 Train 04 (Global Sprint 2023 - 05) QE Work Items
-
- Closed
-

