-
Bug
-
Resolution: Unresolved
-
 Major
Major
-
ACM 2.16.0
Description of problem:
Tying to test ACM-22533 in the large perf/scale env with 2500+ managed SNOs.
After enable MCOA, there are lots of "context deadline exceeded" error in the logs of the observability-thanos-receive pods. examples are shown below
ts=2026-02-18T21:55:09.271237405Z caller=handler.go:637 level=error component=receive component=receive-handler tenant=f5e0558d-16cb-499e-8b31-50be09a157b9 err="context deadline exceeded" msg="internal server error"
ts=2026-02-18T21:55:09.234831218Z caller=handler.go:637 level=error component=receive component=receive-handler tenant=f5e0558d-16cb-499e-8b31-50be09a157b9 err="context deadline exceeded" msg="internal server error"
ts=2026-02-18T21:55:09.345420213Z caller=handler.go:637 level=error component=receive component=receive-handler tenant=f5e0558d-16cb-499e-8b31-50be09a157b9 err="context deadline exceeded" msg="internal server error"
ts=2026-02-18T21:55:09.777473285Z caller=handler.go:637 level=error component=receive component=receive-handler tenant=f5e0558d-16cb-499e-8b31-50be09a157b9 err="context deadline exceeded" msg="internal server error"
ts=2026-02-18T21:55:09.781436352Z caller=handler.go:637 level=error component=receive component=receive-handler tenant=f5e0558d-16cb-499e-8b31-50be09a157b9 err="context deadline exceeded" msg="internal server error"
these errors were not there before MCOA is enable. Checked the agents on the managed SNOs, the prom-agent-platform-metrics-collector-0 pod log has corresponding errors, examples are shown below
time=2026-02-18T22:00:09.601Z level=WARN source=queue_manager.go:2027 msg="Failed to send batch, retrying" component=remote remote_name=acm-observability url=https://observatorium-api-open-cluster-management-observability.apps.acm-gigantic.rdu2.scalelab.redhat.com/api/metrics/v1/default/api/v1/receive err="server returned HTTP status 500 Internal Server Error: context deadline exceeded\n"
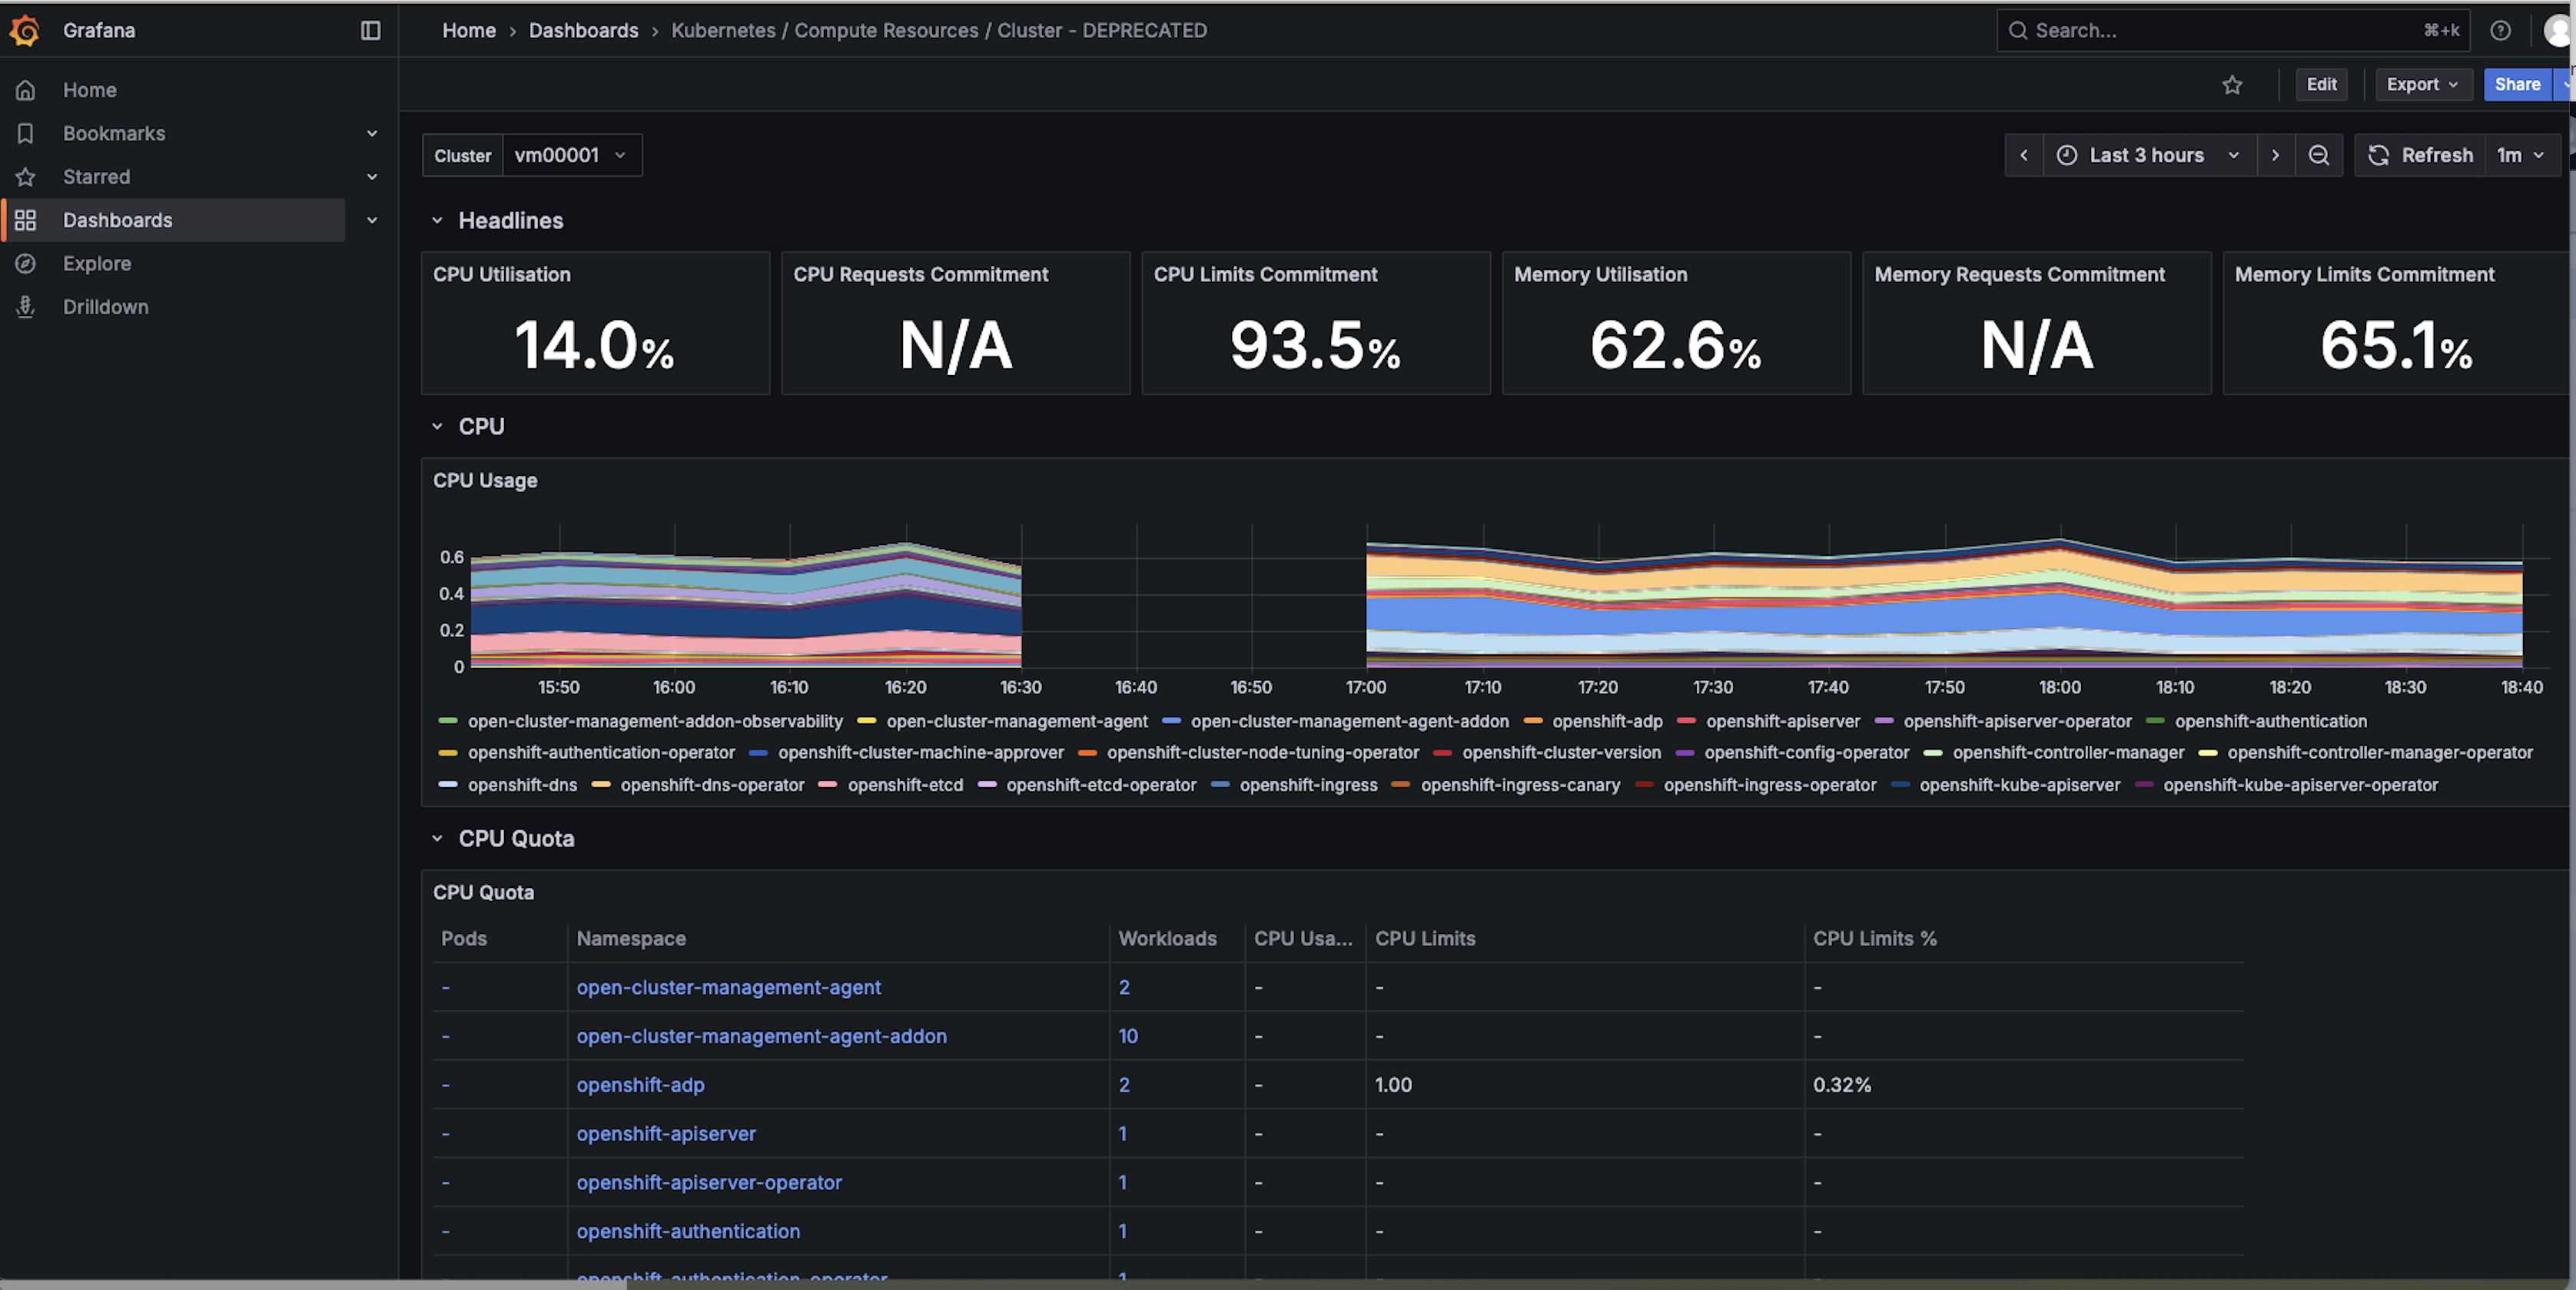
checked the grafana dashboard, as shown in the below screen shot for one of the SNOs, the cpu usage data appears after the new agents are installed, after the small gap. So looks like the metrics pushing to the server is not totally broken, just some of them are timed out. Attatching the thanos receive pod logs before MCOA is enabled run11_b4_MCOA_observability-thanos-receive-default-2-thanos-receive.log![]() and the logs after MCOA is enabled. Also the agents logs before MCOA is enabled: vm00001_metrics-collector-deployment.log
and the logs after MCOA is enabled. Also the agents logs before MCOA is enabled: vm00001_metrics-collector-deployment.log![]() and the new agent log after MCOA is enabled: vm00001_prom-agent-platform-metrics-collector-0.log
and the new agent log after MCOA is enabled: vm00001_prom-agent-platform-metrics-collector-0.log![]()

Version-Release number of selected component (if applicable):
How reproducible:
Steps to Reproduce:
- ...