-
Bug
-
Resolution: Not a Bug
-
 Undefined
-
None
-
None
-
None
-
Quality / Stability / Reliability
-
False
-
-
False
-
-
-
Moderate
-
None
Description of problem:
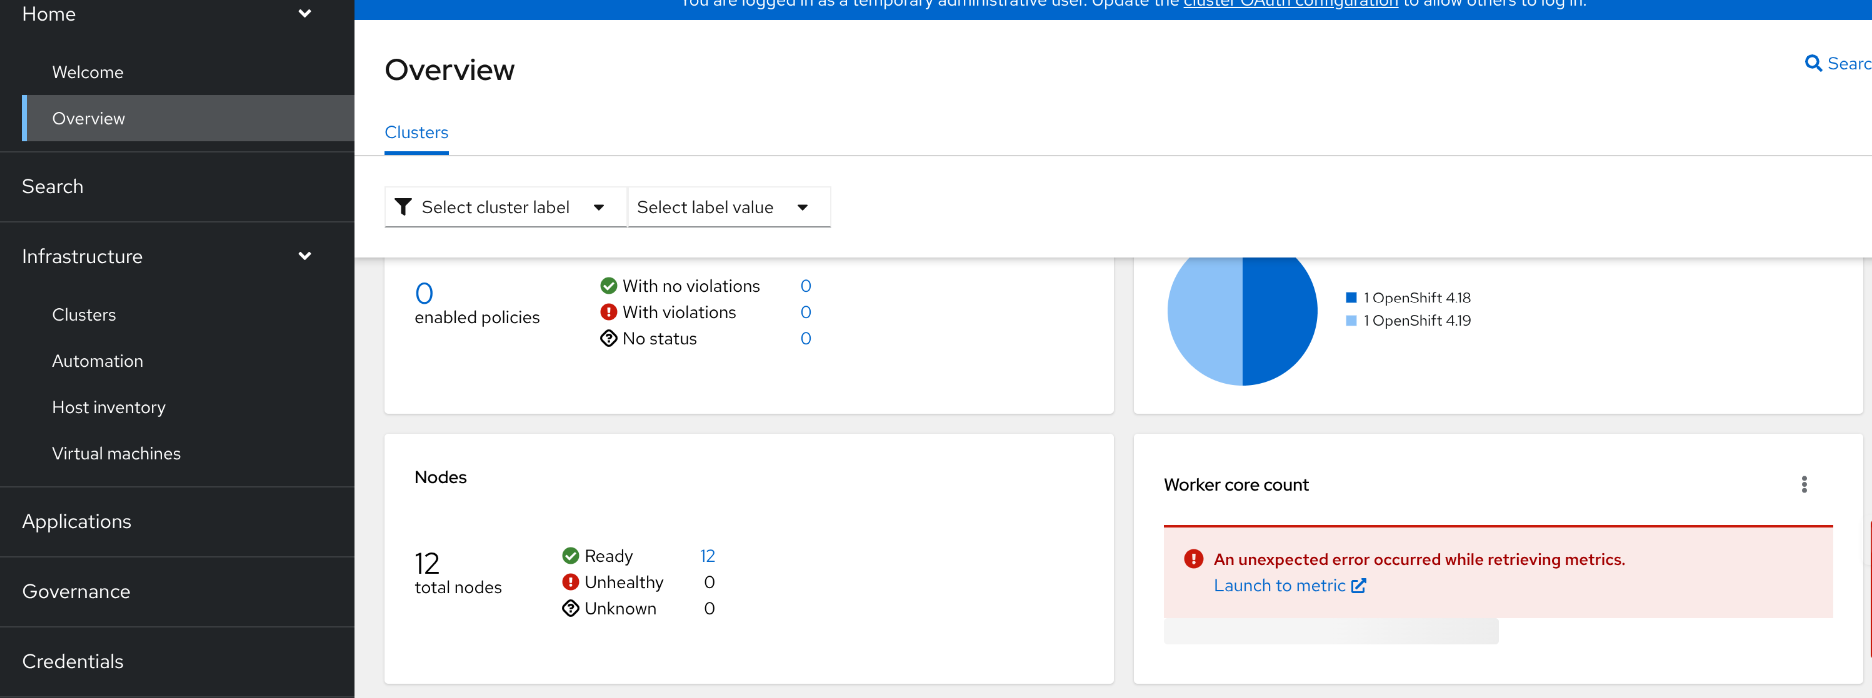
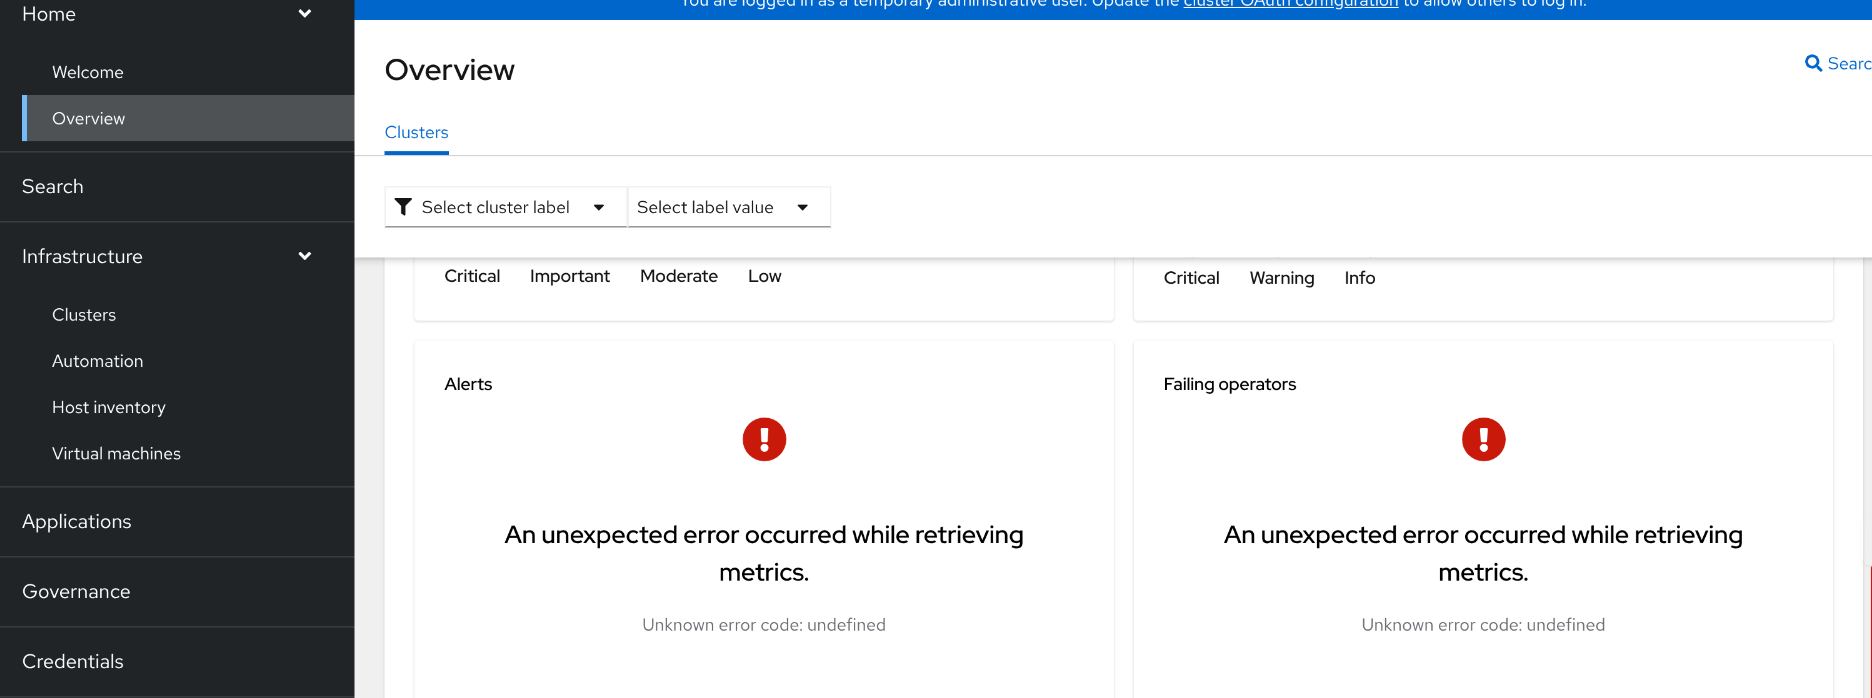
installed ACM 2.13 RC4 and enabled ACM observability on OCP 4.18.4 AWS http_proxy cluster, go to muliticloud overview page, "Home -> Overview", "An unexpected error occurred while retrieving metrics" shows for "Woker core count" and Alerts/Failing operators after long waiting, see pictures
$ oc get clusterversion
NAME      VERSION   AVAILABLE   PROGRESSING   SINCE   STATUS
version   4.18.4    True        False         7h12m   Cluster version is 4.18.4

$ oc get catalogsource acm-custom-registry -n openshift-marketplace -o jsonpath='{.spec.image}'
quay.io:443/acm-d/acm-custom-registry:2.13.0-DOWNSTREAM-2025-03-07-03-19-34

$ oc get proxy/cluster -oyaml
apiVersion: config.openshift.io/v1
kind: Proxy
metadata:
  creationTimestamp: "2025-03-17T00:21:37Z"
  generation: 1
  name: cluster
  resourceVersion: "443"
  uid: f364b410-9c82-445a-a8c5-ebc161441830
spec:
  httpProxy: http://proxy-user2:***@***:3128
  httpsProxy: http://proxy-user2:***@***:3128
  noProxy: test.no-proxy.com
  trustedCA:
    name: ""
status:
  httpProxy: http://proxy-user2:***@***:3128
  httpsProxy: http://proxy-user2:***@***:3128
  noProxy: .cluster.local,.svc,.us-east-2.compute.internal,10.0.0.0/16,10.128.0.0/14,127.0.0.1,169.254.169.254,172.30.0.0/16,api-int.***.qe.devcluster.openshift.com,localhost,test.no-proxy.com
debug steps: oc login first
# oc login https://<apisever>:6443 -u kubeadmin -p <password>
could find result for acm_managed_cluster_worker_cores metrics, but 443 error for open-cluster-management-observability alertmanager API
# token=`oc whoami -t`
# oc -n openshift-monitoring exec -c prometheus prometheus-k8s-0 -- curl -k -H "Authorization: Bearer $token" https://clusterlifecycle-state-metrics-v2.multicluster-engine.svc:8443/metrics | grep acm_managed_cluster_worker_cores
# HELP acm_managed_cluster_worker_cores The number of worker CPU cores of ACM managed clusters
# TYPE acm_managed_cluster_worker_cores gauge
acm_managed_cluster_worker_cores{hub_cluster_id="ed9b24a4-6d06-413c-8800-ee2926bb126a",managed_cluster_id="ed9b24a4-6d06-413c-8800-ee2926bb126a"} 12

# alertroute=$(oc -n open-cluster-management-observability get route alertmanager -ojsonpath='{.spec.host}')
# oc -n openshift-monitoring exec -c prometheus prometheus-k8s-0 -- curl -k -H "Authorization: Bearer $token" https://${alertroute}/api/v2/alerts | jq curl: (28) Failed to connect to alertmanager-open-cluster-management-observability.apps.juzhao-proxya.qe.devcluster.openshift.com port 443: Connection timed out
command terminated with exit code 28
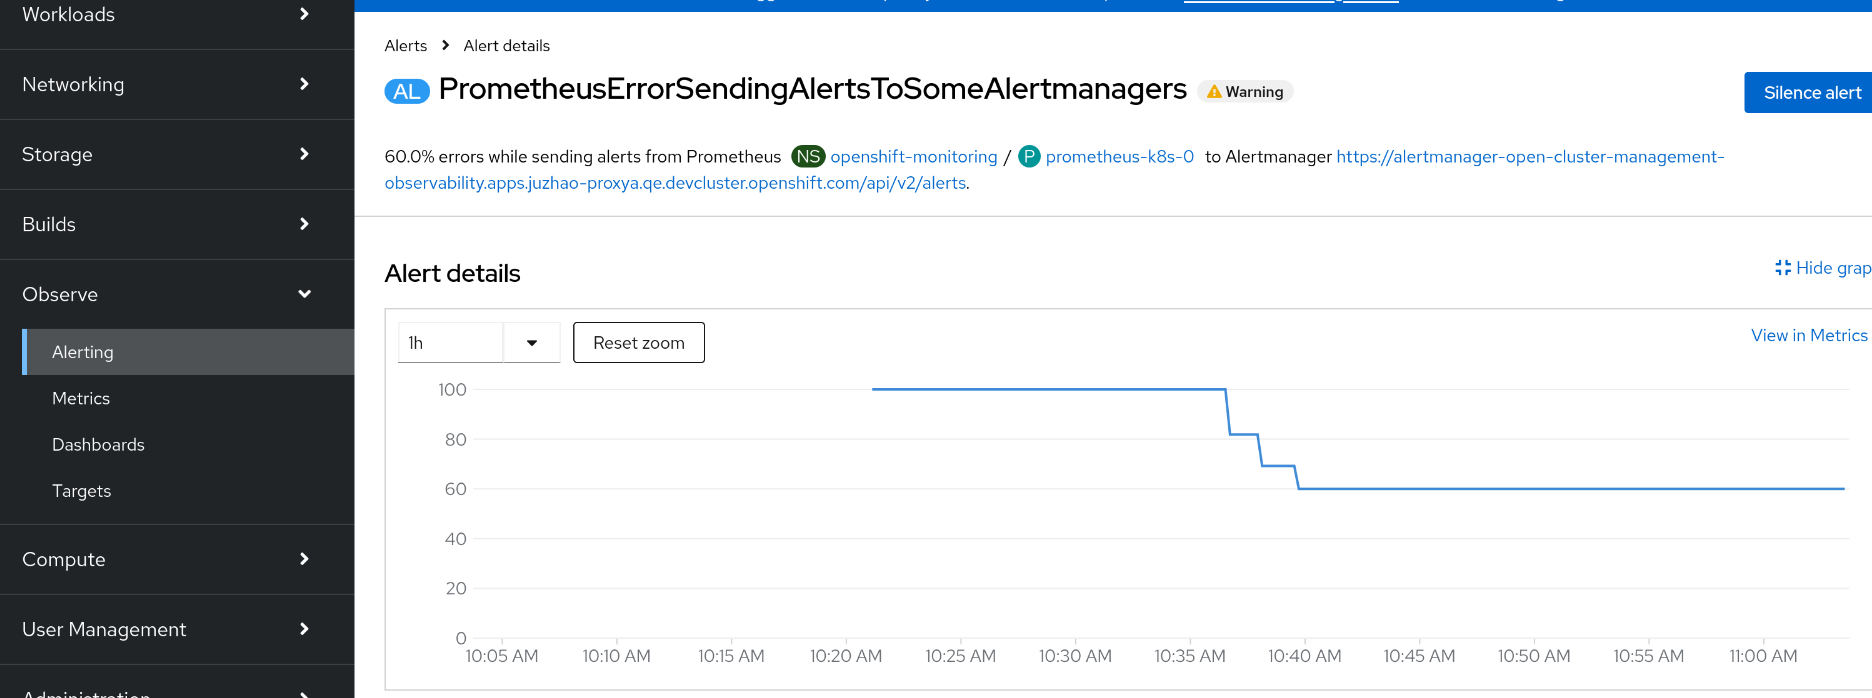
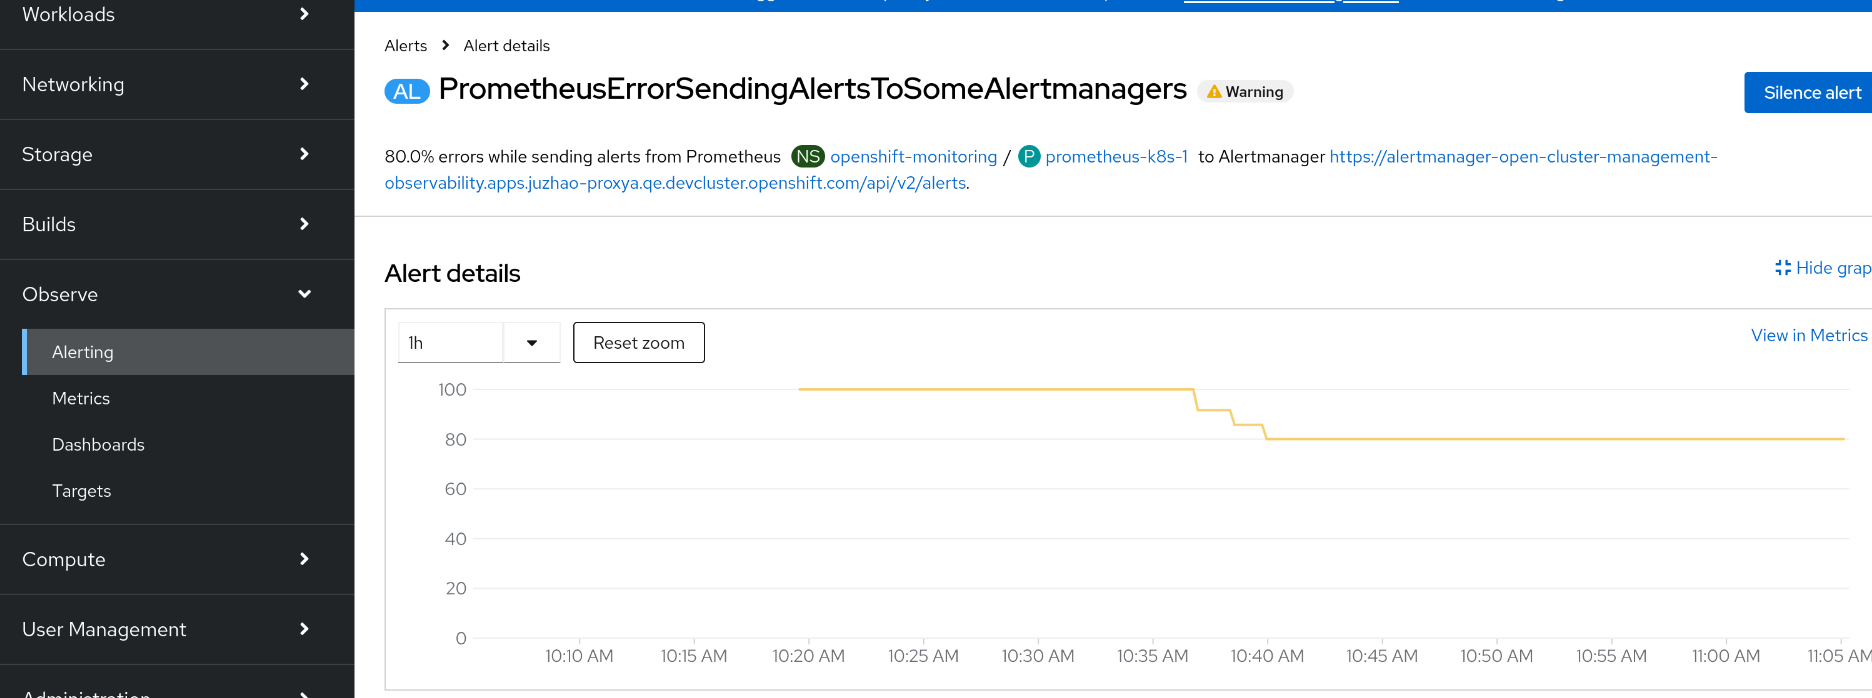
and there are PrometheusErrorSendingAlertsToSomeAlertmanagers alerts for openshift-monitoring prometheus to open-cluster-management-observability alertmanager API, see picture
$ oc -n openshift-monitoring exec -c prometheus prometheus-k8s-0 -- curl -k -H "Authorization: Bearer $token" 'https://alertmanager-main.openshift-monitoring.svc:9094/api/v2/alerts?&filter={alertname="PrometheusErrorSendingAlertsToSomeAlertmanagers"}' | jq
[
  {
    "annotations": {
      "description": "85.7% errors while sending alerts from Prometheus openshift-monitoring/prometheus-k8s-1 to Alertmanager https://alertmanager-open-cluster-management-observability.apps.juzhao-proxya.qe.devcluster.openshift.com/api/v2/alerts.",
      "summary": "Prometheus has encountered more than 1% errors sending alerts to a specific Alertmanager."
    },
    "endsAt": "2025-03-17T09:04:17.213Z",
    "fingerprint": "c361e7c810b49df0",
    "receivers": [
      {
        "name": "Default"
      }
    ],
    "startsAt": "2025-03-17T02:34:47.213Z",
    "status": {
      "inhibitedBy": [],
      "silencedBy": [],
      "state": "active"
    },
    "updatedAt": "2025-03-17T09:00:24.237Z",
    "generatorURL": "https://console-openshift-console.apps.juzhao-proxya.qe.devcluster.openshift.com/monitoring/graph?g0.expr=%28rate%28prometheus_notifications_errors_total%7Bjob%3D~%22prometheus-k8s%7Cprometheus-user-workload%22%7D%5B5m%5D%29+%2F+rate%28prometheus_notifications_sent_total%7Bjob%3D~%22prometheus-k8s%7Cprometheus-user-workload%22%7D%5B5m%5D%29%29+%2A+100+%3E+1&g0.tab=1",
    "labels": {
      "alertmanager": "https://alertmanager-open-cluster-management-observability.apps.juzhao-proxya.qe.devcluster.openshift.com/api/v2/alerts",
      "alertname": "PrometheusErrorSendingAlertsToSomeAlertmanagers",
      "container": "kube-rbac-proxy",
      "endpoint": "metrics",
      "instance": "10.129.2.69:9092",
      "job": "prometheus-k8s",
      "managed_cluster": "ed9b24a4-6d06-413c-8800-ee2926bb126a",
      "namespace": "openshift-monitoring",
      "openshift_io_alert_source": "platform",
      "pod": "prometheus-k8s-1",
      "prometheus": "openshift-monitoring/k8s",
      "service": "prometheus-k8s",
      "severity": "warning"
    }
  },
  {
    "annotations": {
      "description": "71.4% errors while sending alerts from Prometheus openshift-monitoring/prometheus-k8s-0 to Alertmanager https://alertmanager-open-cluster-management-observability.apps.juzhao-proxya.qe.devcluster.openshift.com/api/v2/alerts.",
      "summary": "Prometheus has encountered more than 1% errors sending alerts to a specific Alertmanager."
    },
    "endsAt": "2025-03-17T09:04:17.213Z",
    "fingerprint": "fb58fe93374ce305",
    "receivers": [
      {
        "name": "Default"
      }
    ],
    "startsAt": "2025-03-17T02:36:17.213Z",
    "status": {
      "inhibitedBy": [],
      "silencedBy": [],
      "state": "active"
    },
    "updatedAt": "2025-03-17T09:00:24.237Z",
    "generatorURL": "https://console-openshift-console.apps.juzhao-proxya.qe.devcluster.openshift.com/monitoring/graph?g0.expr=%28rate%28prometheus_notifications_errors_total%7Bjob%3D~%22prometheus-k8s%7Cprometheus-user-workload%22%7D%5B5m%5D%29+%2F+rate%28prometheus_notifications_sent_total%7Bjob%3D~%22prometheus-k8s%7Cprometheus-user-workload%22%7D%5B5m%5D%29%29+%2A+100+%3E+1&g0.tab=1",
    "labels": {
      "alertmanager": "https://alertmanager-open-cluster-management-observability.apps.juzhao-proxya.qe.devcluster.openshift.com/api/v2/alerts",
      "alertname": "PrometheusErrorSendingAlertsToSomeAlertmanagers",
      "container": "kube-rbac-proxy",
      "endpoint": "metrics",
      "instance": "10.128.2.71:9092",
      "job": "prometheus-k8s",
      "managed_cluster": "ed9b24a4-6d06-413c-8800-ee2926bb126a",
      "namespace": "openshift-monitoring",
      "openshift_io_alert_source": "platform",
      "pod": "prometheus-k8s-0",
      "prometheus": "openshift-monitoring/k8s",
      "service": "prometheus-k8s",
      "severity": "warning"
    }
  }
]
compared with non http_proxy cluster, no issue for the alertmanager API
$ oc get proxy/cluster -oyaml
apiVersion: config.openshift.io/v1
kind: Proxy
metadata:
  creationTimestamp: "2025-03-17T03:15:17Z"
  generation: 1
  name: cluster
  resourceVersion: "525"
  uid: d25192fa-473b-4551-ab2a-8292ca278bf6
spec:
  trustedCA:
    name: ""
status: {}

# oc login https://<apisever>:6443 -u kubeadmin -p <password>
# token=`oc whoami -t`
# oc -n openshift-monitoring exec -c prometheus prometheus-k8s-0 -- curl -k -H "Authorization: Bearer $token" https://clusterlifecycle-state-metrics-v2.multicluster-engine.svc:8443/metrics | grep acm_managed_cluster_worker_cores
# HELP acm_managed_cluster_worker_cores The number of worker CPU cores of ACM managed clusters
# TYPE acm_managed_cluster_worker_cores gauge
acm_managed_cluster_worker_cores{hub_cluster_id="58506e17-a9c8-4e10-8ff3-a36761b4ab7c",managed_cluster_id="58506e17-a9c8-4e10-8ff3-a36761b4ab7c"} 12
acm_managed_cluster_worker_cores{hub_cluster_id="58506e17-a9c8-4e10-8ff3-a36761b4ab7c",managed_cluster_id="fd29b239-9de9-4f76-a818-4e9a7647657c"} 12

# alertroute=$(oc -n open-cluster-management-observability get route alertmanager -ojsonpath='{.spec.host}')
# oc -n openshift-monitoring exec -c prometheus prometheus-k8s-0 -- curl -k -H "Authorization: Bearer $token" https://${alertroute}/api/v2/alerts | jq
...
[
  {
    "annotations": {
      "description": "Alerts are not configured to be sent to a notification system, meaning that you may not be notified in a timely fashion when important failures occur. Check the OpenShift documentation to learn how to configure notifications with Alertmanager.",
      "summary": "Receivers (notification integrations) are not configured on Alertmanager"
    },
    "endsAt": "2025-03-17T07:47:50.334Z",
    "fingerprint": "08d52e673556e000",
    "receivers": [
      {
        "name": "null"
      }
    ],
    "startsAt": "2025-03-17T06:06:20.334Z",
    "status": {
      "inhibitedBy": [],
      "silencedBy": [],
      "state": "active"
    },
    "updatedAt": "2025-03-17T07:43:50.442Z",
    "generatorURL": "https://console-openshift-console.apps.juzhao-acm3.qe.devcluster.openshift.com/monitoring/graph?g0.expr=cluster%3Aalertmanager_integrations%3Amax+%3D%3D+0&g0.tab=1",
    "labels": {
      "alertname": "AlertmanagerReceiversNotConfigured",
      "managed_cluster": "58506e17-a9c8-4e10-8ff3-a36761b4ab7c",
      "namespace": "openshift-monitoring",
      "openshift_io_alert_source": "platform",
      "prometheus": "openshift-monitoring/k8s",
      "severity": "warning"
    }
  },
Version-Release number of selected component (if applicable):
ACM 2.13 RC4 2.13.0-DOWNSTREAM-2025-03-07-03-19-34
How reproducible:
always
Steps to Reproduce:
- setup http_proxy cluster
- install ACM and ACM observability
- check muliticloud overview page, "Home -> Overview"
Actual results:
http_proxy cluster, muliticloud overview page, "An unexpected error occurred while retrieving metrics" shows for "Woker core count" and Alerts/Failing operators
Expected results:
no error
Additional info:
seems the same root cause as ACM-18898

