-
Bug
-
Resolution: Done
-
 Normal
-
None
-
ACM 2.11.Z
-
False
-
-
False
-
-
-
Low
-
None
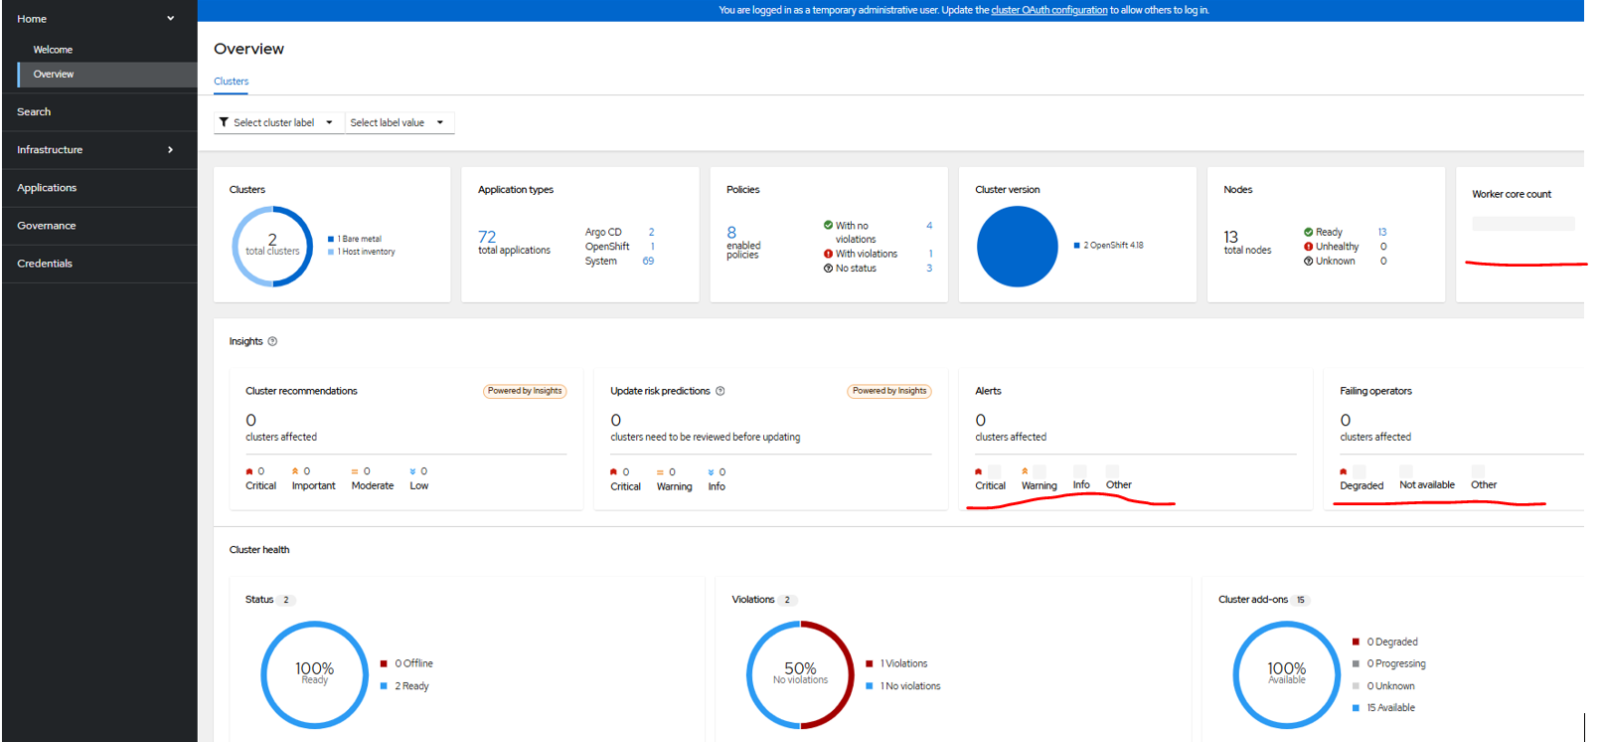
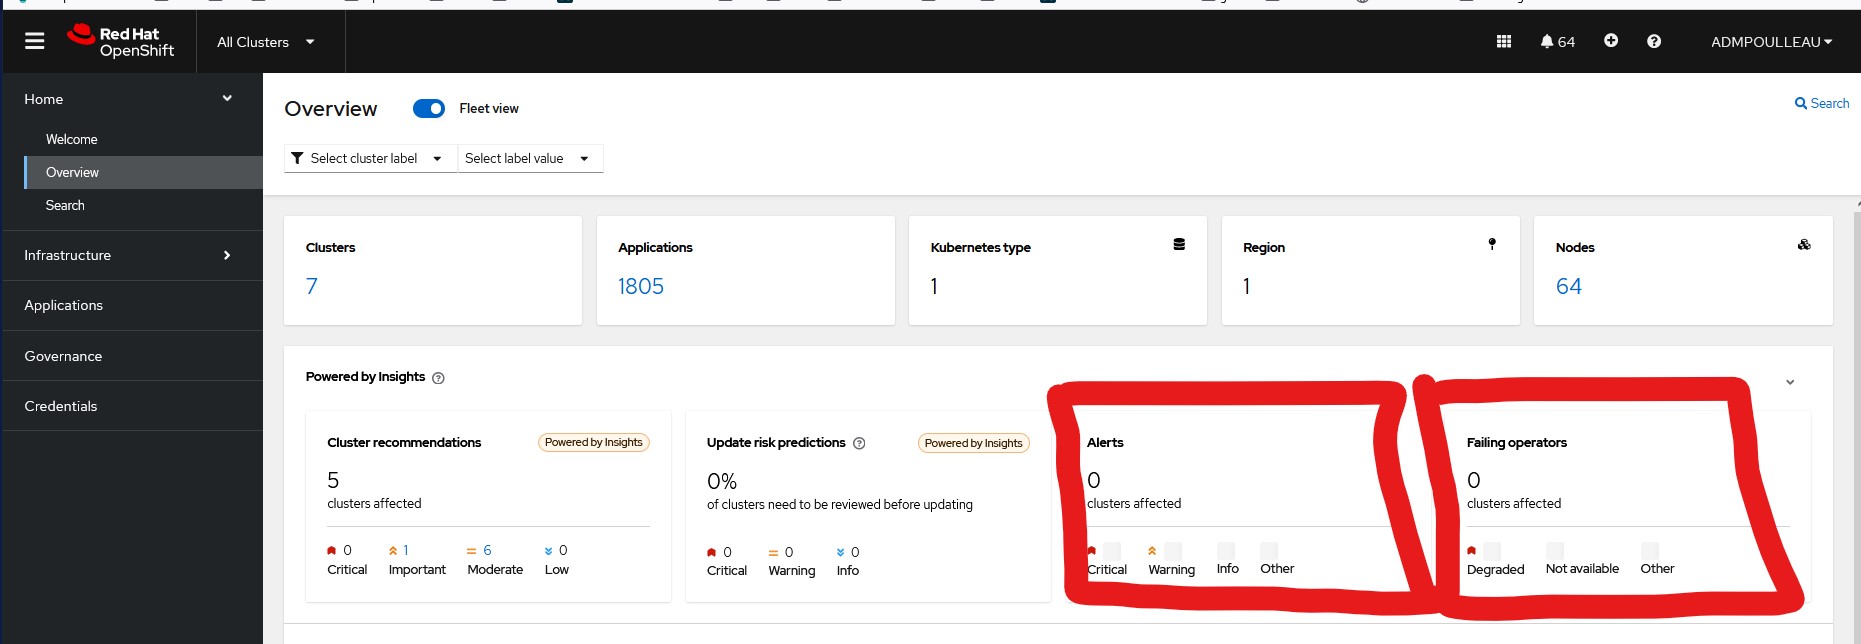
Description of problem:
In ACM Overview page, after switching to Fleet view, the Alert and Failing Operator metrics is not showing and blurred even when observability is enabled.
Verified that the alertmanager is capturing the metrics successfully and data is visible on Grafana dashboard.
Version-Release number of selected component (if applicable):
ACM 2.11.3
OCP 4.16
Expected results:
If observability is enabled, alert and failing operator metrics from across your fleet should be displayed when using the Fleet view switch from the ACM Overview page.
Additional info:
From the Browser Inspect logs it is observed that they are getting a 504 error which seems because `rbac-query-proxy` server is unhealthy.

- relates to
-
-

- Closed
-
