Uploaded image for project: 'Automation Analytics'
  1. Automation Analytics
  2. AA-1734

Chart with Historical usage of the subscription in platform UI

XMLWordPrintable

    • Icon: Task Task
    • Resolution: Test Pending
    • Icon: Normal Normal
    • 2.5
    • None
    • None
    • None
    • Sprint ending July 20, 2023, Sprint ending Aug 17, 2023, Sprint ending Sept 14, 2023

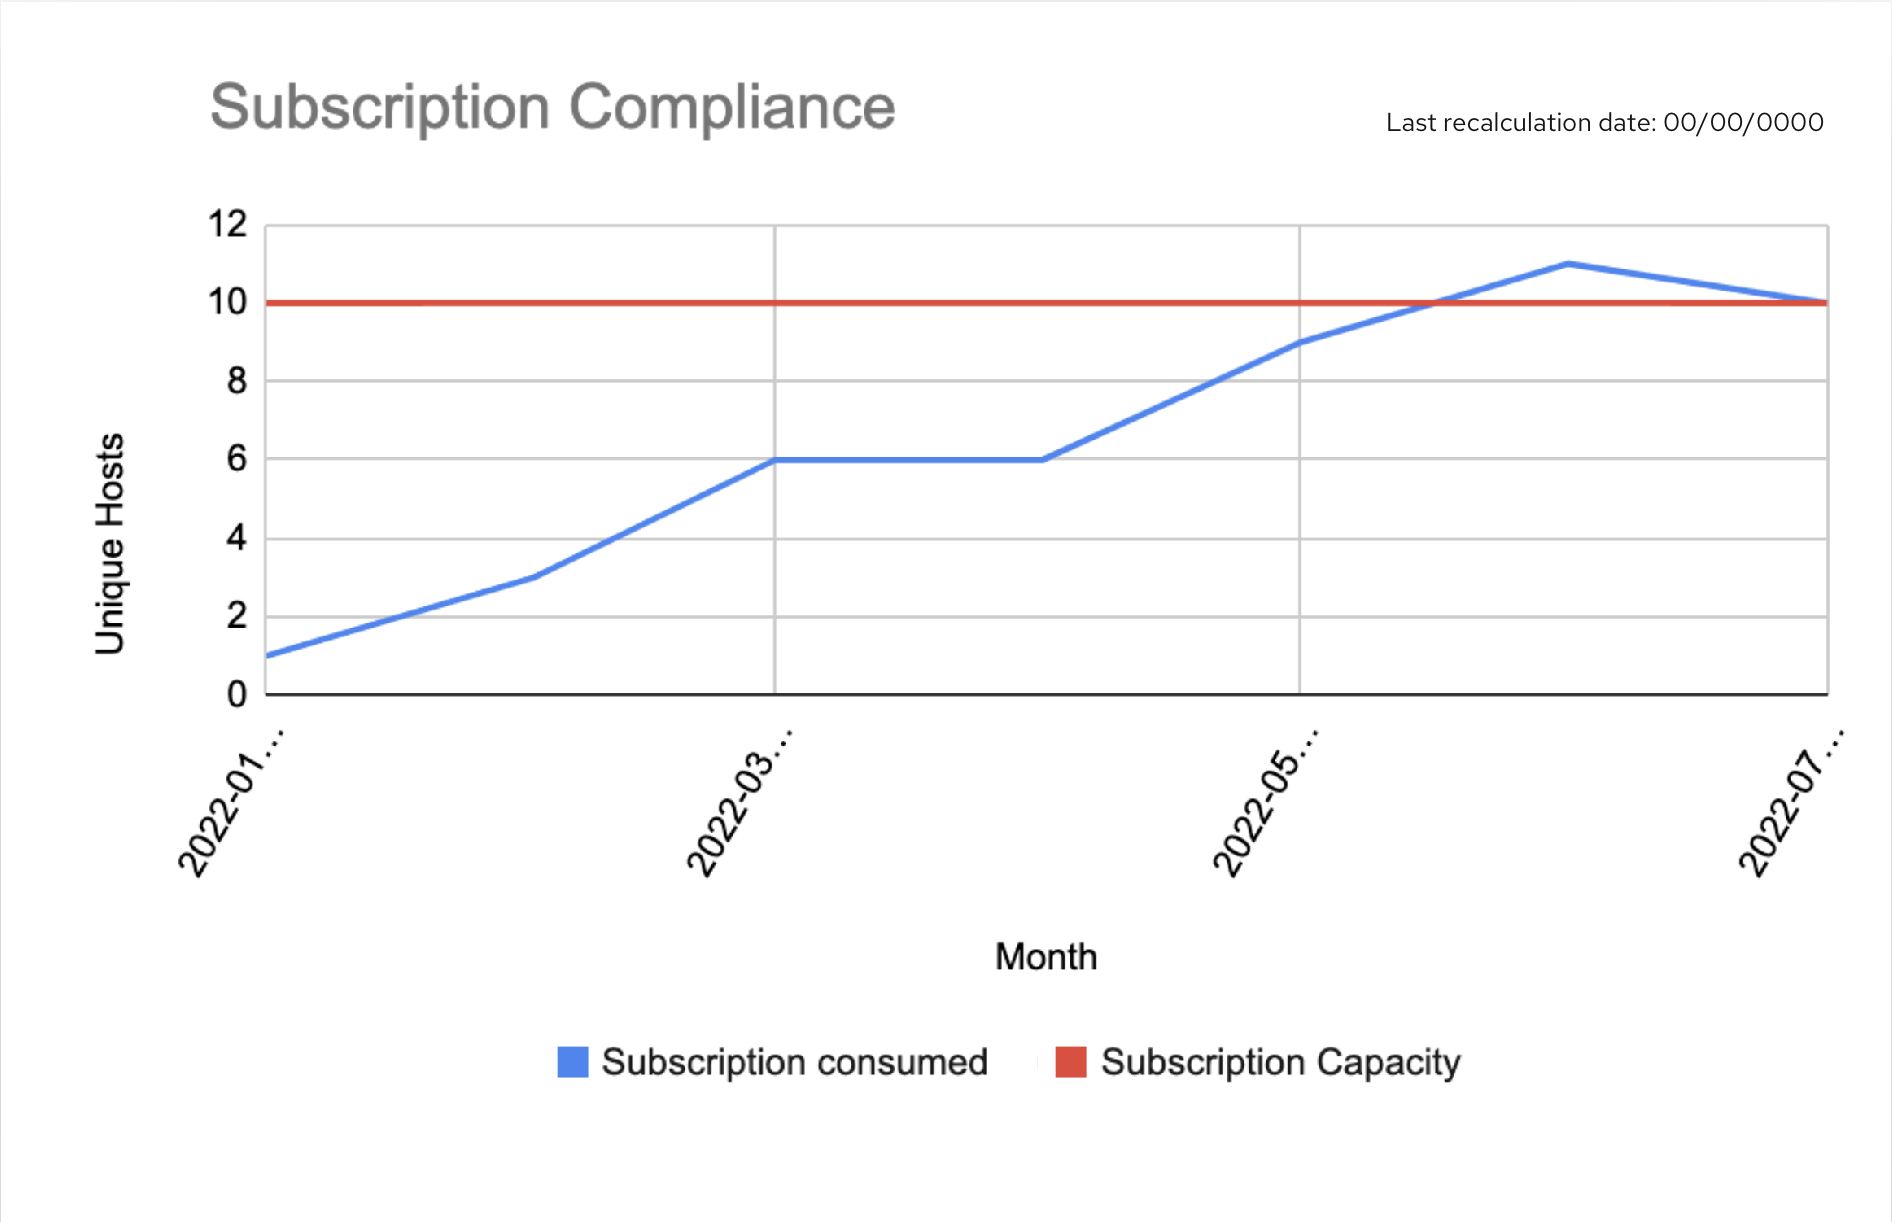
      Chart details (see image below):

      • X axis: HostMetricSummaryMonthly.date (Month)
      • Y axis:
        • red line: HostMetricSummaryMonthly.license_capacity  (Subscription capacity)
        • blue line: HostMetricSummaryMonthly.license_consumed  (Subscription consumed)

      Dropdown should have ability to filter by:

      • Past year (default)
      • Past 2 years
      • Past 3 years

      see section 7.2 in https://docs.google.com/document/d/1hv14yISL8GlX0Kd-xO9h9JFP9snyob5wEfUDlBimwIc/edit#heading=h.jxj1o8qqpjmj for more details.

              skochay Salma Kochay
              hkataria-insights Harpreet Kataria
              Ingrid Sena Ingrid Sena
              Elizabeth Murtough Elizabeth Murtough
              Ladislav Smola Ladislav Smola
              Zita Nemeckova Zita Nemeckova
              Votes:
              0 Vote for this issue
              Watchers:
              4 Start watching this issue

                Created:
                Updated:
                Resolved: