-
Bug
-
Resolution: Unresolved
-
 Undefined
-
None
-
openshift-4.21
-
None
-
None
-
None
-
False
-
-
1
-
None
-
None
-
None
-
Sprint 281
-
None
-
None
-
None
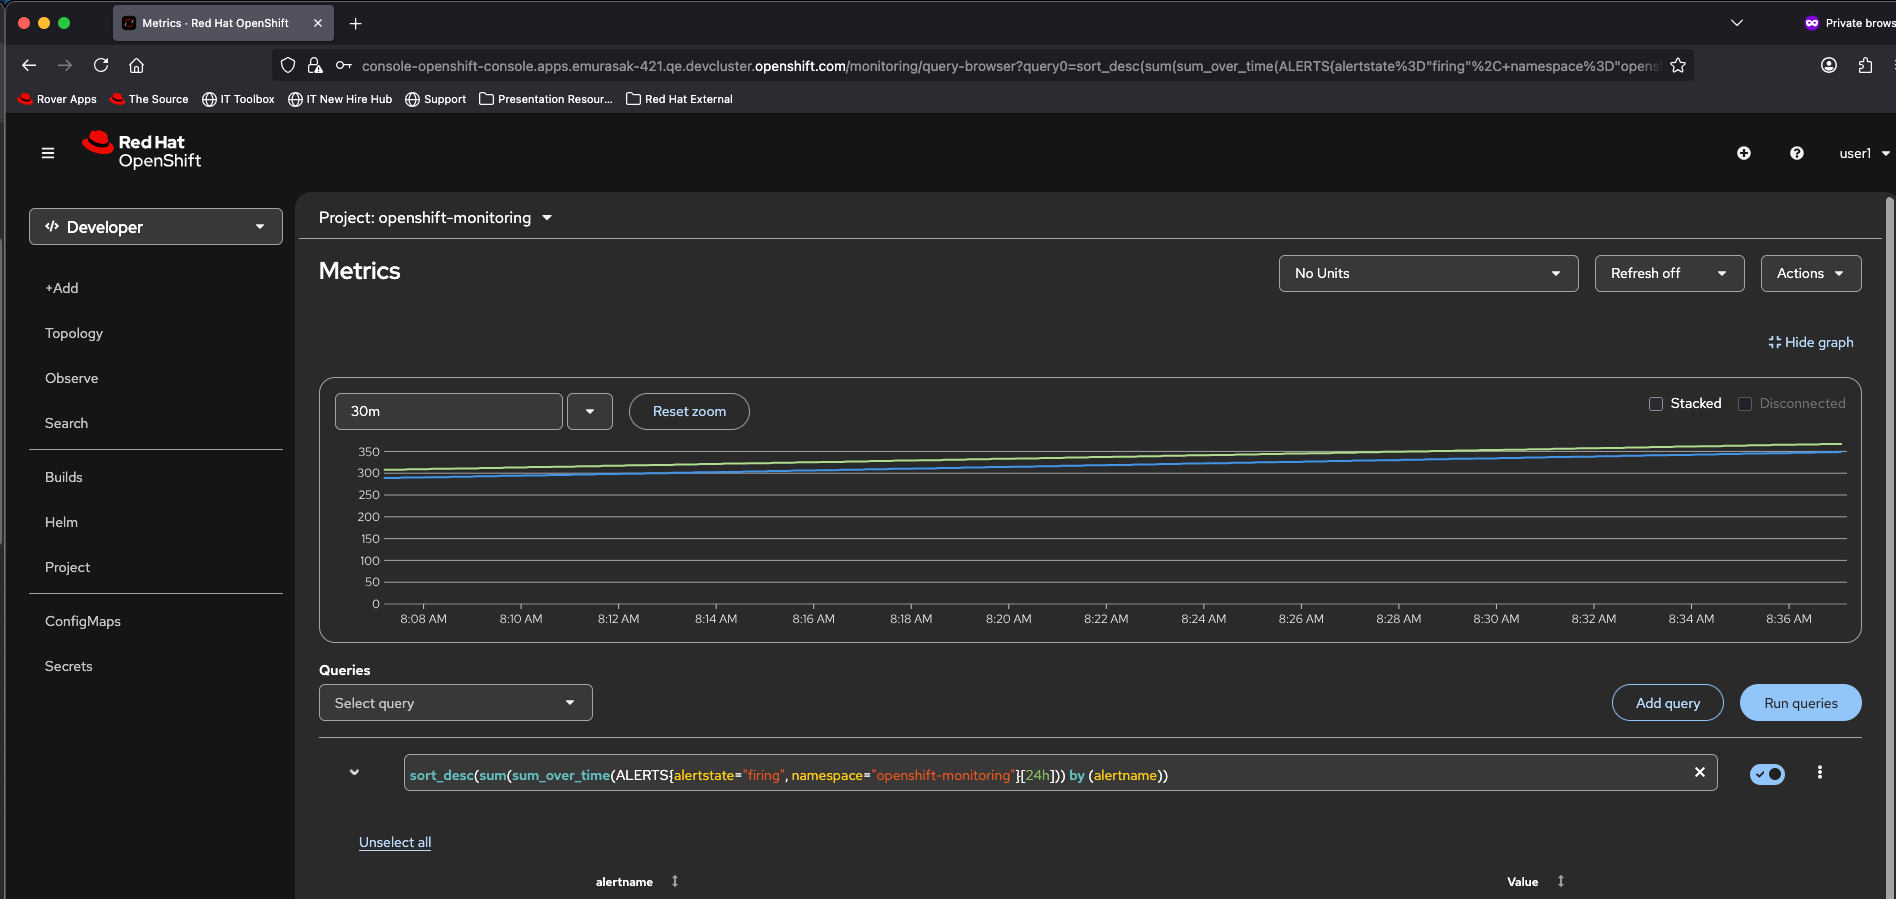
- Login as kubeadmin
- Go To Observe > Metrics
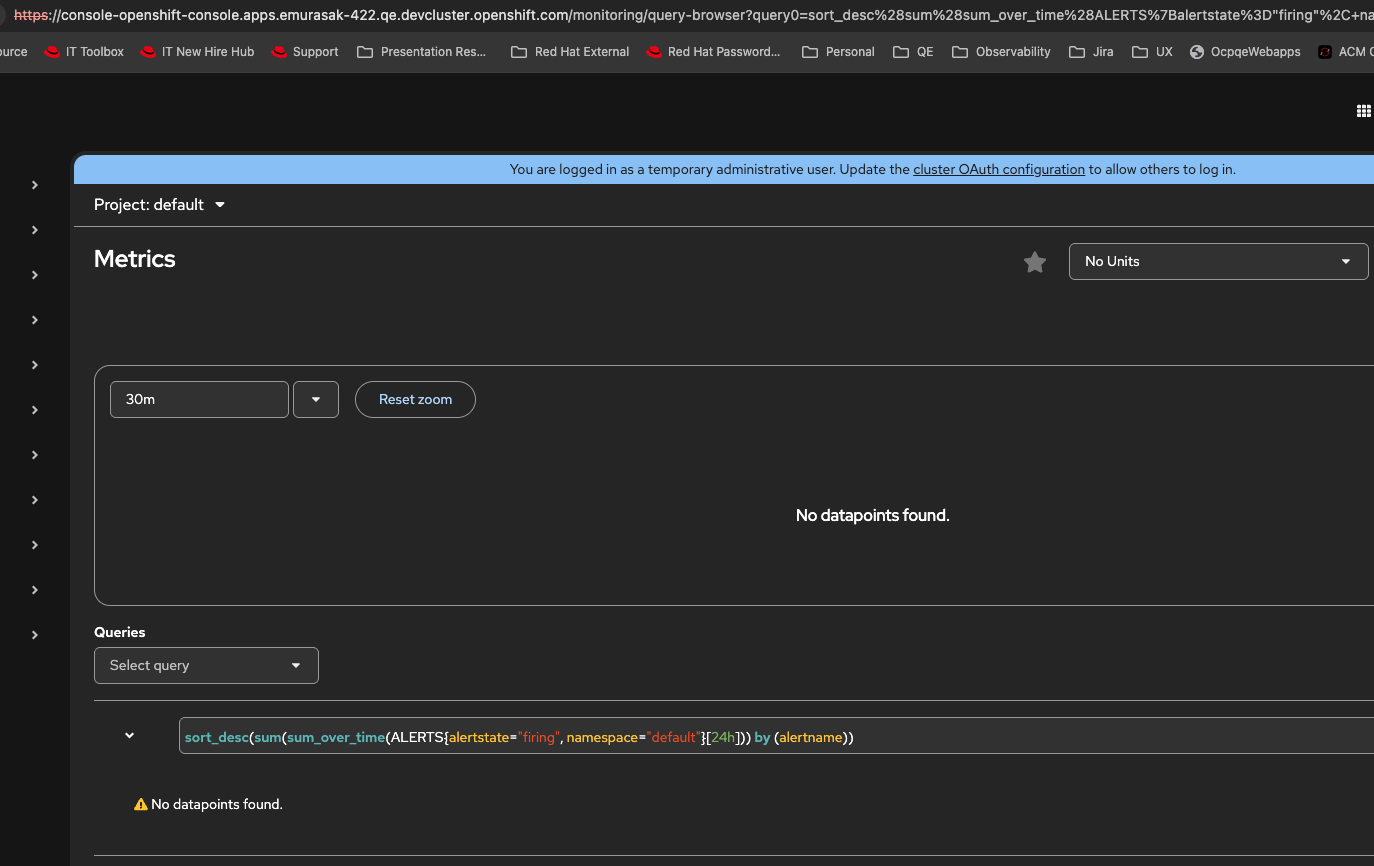
- Change namespace to default
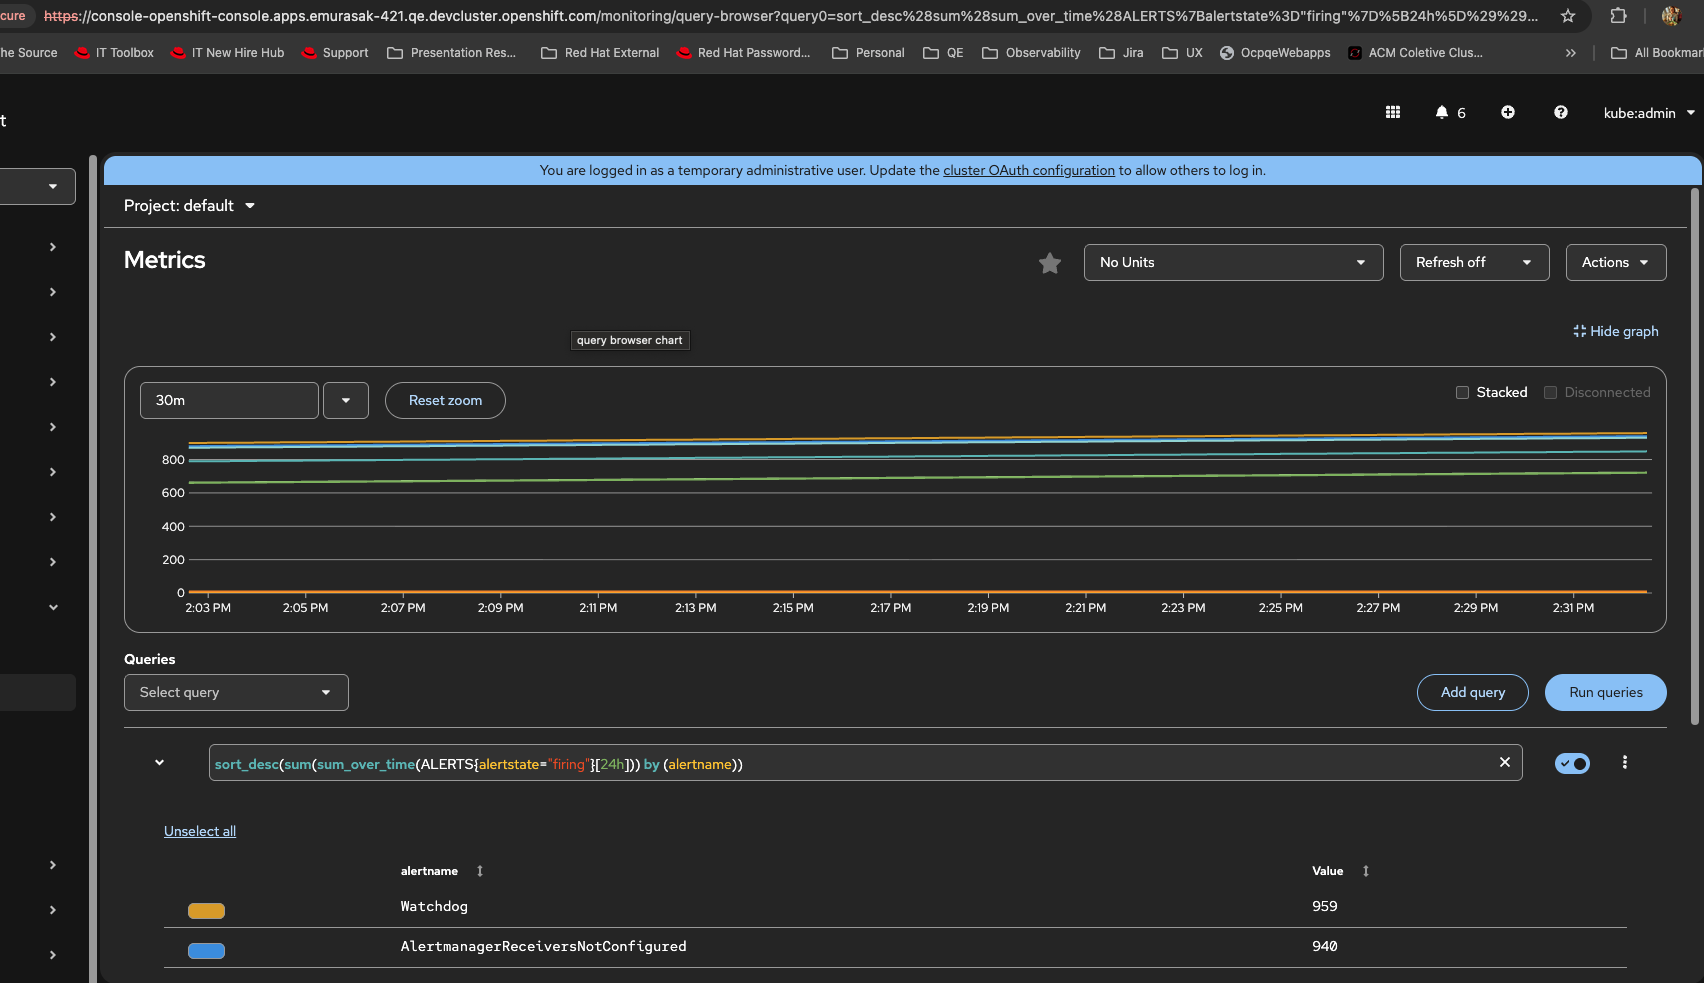
- Click on Insert query example
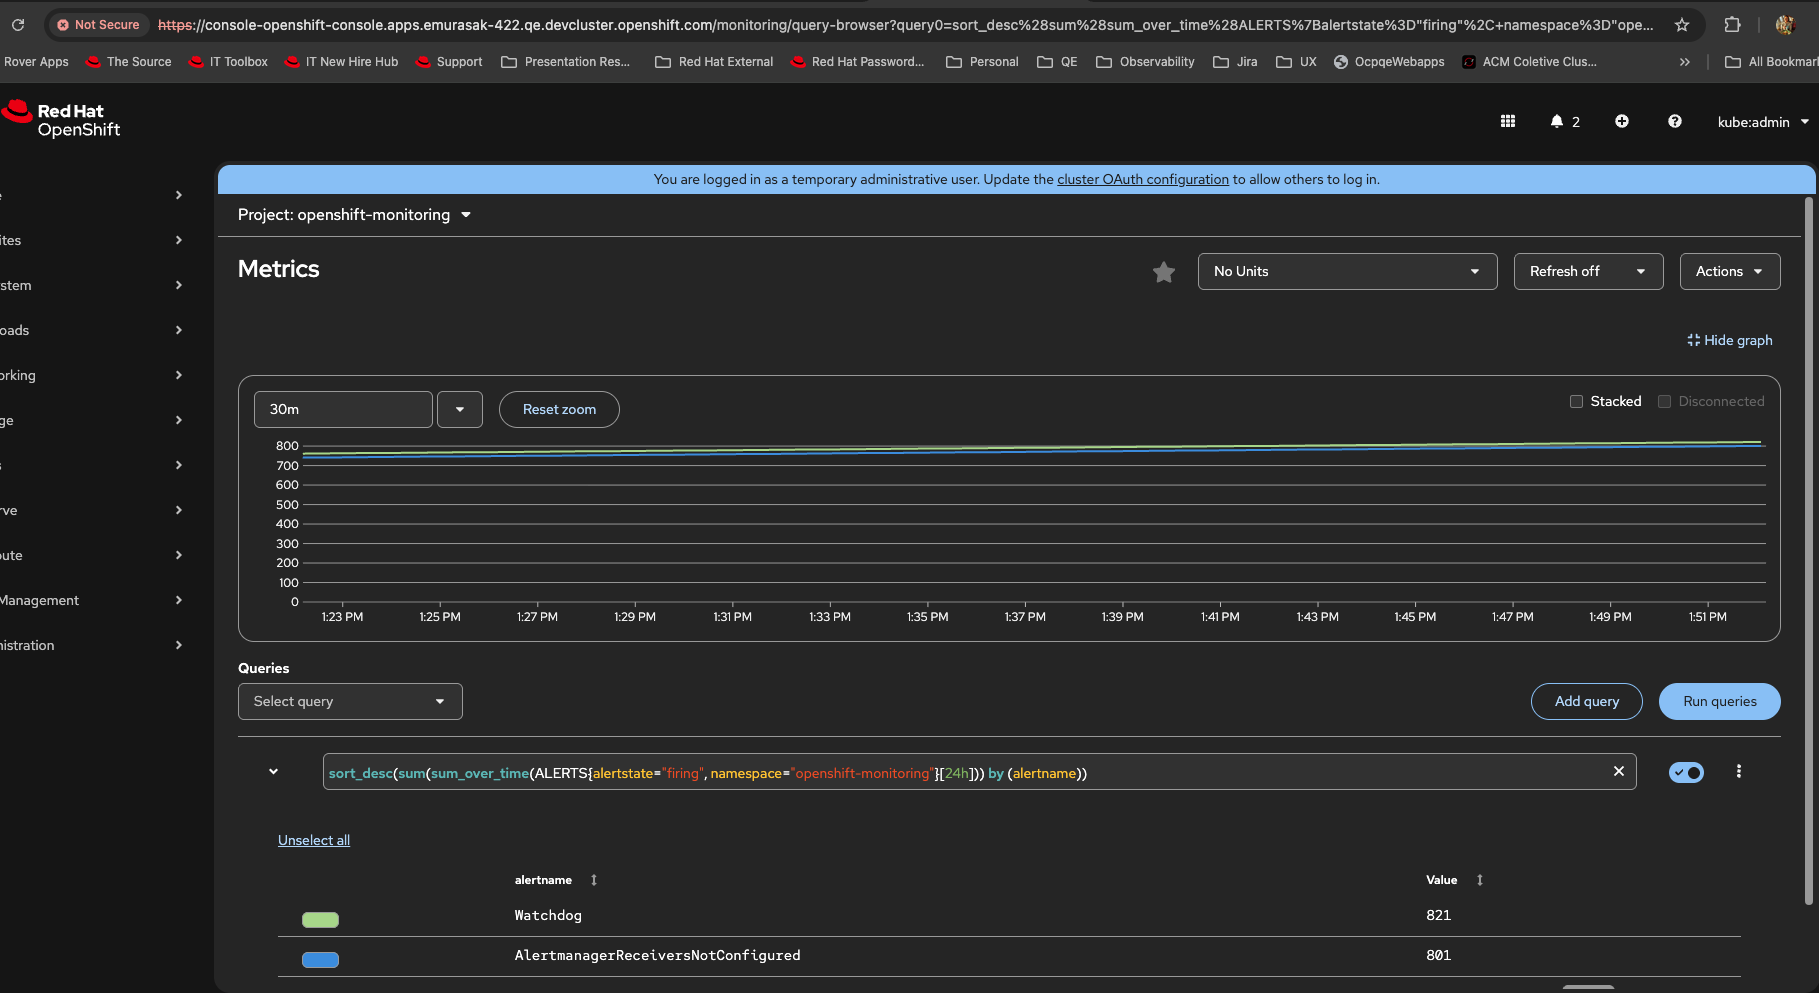
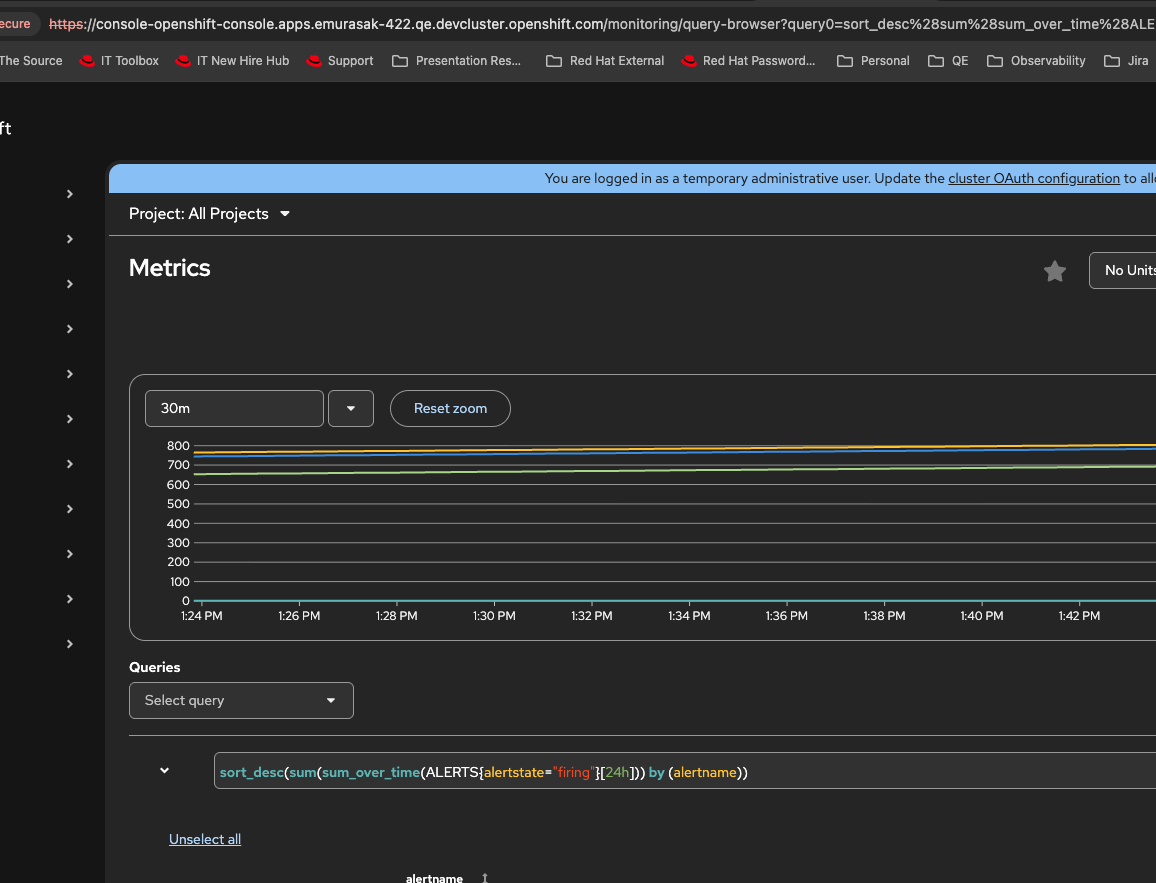
- Result: It is returning metrics based on alerts from other namespaces, like watchdog and others from openshift-monitoring
- Expected Result: Shouldn't this query be based on default namespace?
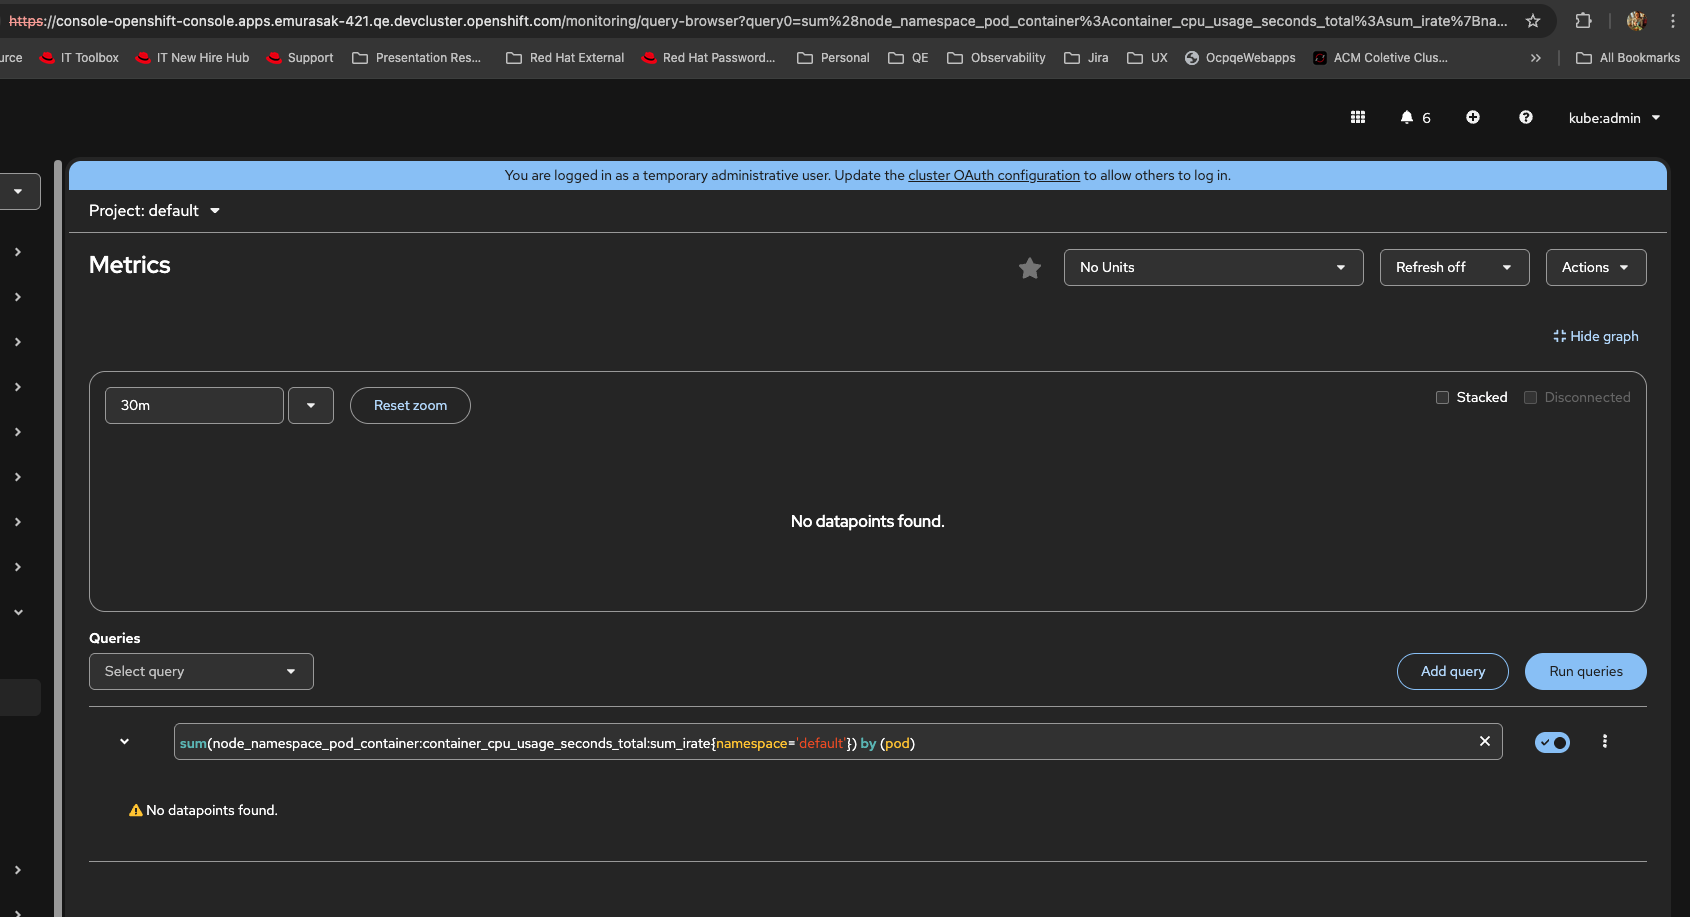
- I am comparing to Predefined queries, CPU Usage i.e there is no datapoints and in the query you can see namespace=default
- I am also comparing to my existing metrics automated testing for namespace level, that before I got an empty state https://github.com/openshift/monitoring-plugin/blob/3d7806cce3033d886953807048837eace3c1c9cf/web/cypress/support/monitoring/05.reg_metrics_namespace.cy.ts#L481

- relates to
-
OU-949 As a dev user I want to be able to see the non-metric monitoring views inside the admin perspective
-

- Closed
-
- links to