Uploaded image for project: 'jBPM'
  1. jBPM
  2. JBPM-4922

Missing X axis labels for some charts

    XMLWordPrintable

Details

    • NEW
    • NEW

    Description

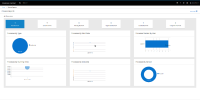
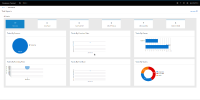
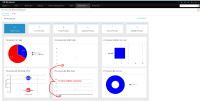
      Could you please enable X Axis labels for charts:
      1. in Process dashboard
      a. Processes by start date
      b. Processes by end date
      2. in Task dashboard
      a. Tasks by creation date
      b. Tasks by end date

      In cases when lots of data is present it's not immediately clear which days have peaks Although it IS possible to mouse over the charts and see the popup bubble, I think it would be more convenient for users if the dates were shown as the X Axis labels.

      Attachments

        1. Fixed Process Reports.png
          Fixed Process Reports.png
          67 kB
        2. Fixed Task Reports.png
          Fixed Task Reports.png
          71 kB
        3. ProcessDashboard.png
          ProcessDashboard.png
          82 kB
        4. TaskDashboard.png
          TaskDashboard.png
          89 kB

        Issue Links

          Activity

            People

              david.magallanes David Gutierrez
              jhrcek Jan Hrcek (Inactive)
              Votes:
              0 Vote for this issue
              Watchers:
              4 Start watching this issue

              Dates

                Created:
                Updated:
                Resolved: